
Preface
At Kujira Track, we offer a comprehensive suite of tools to track metrics across the Kujira blockchain. One benefit of our data is the ability to better understand the evolution of the Kujira network over time by analyzing relevant statistics. We noticed a clear pattern of growth since the chain’s launch.
To bring greater transparency and attention towards this growth, we decided to debut a Kujira report. This first iteration tracks a few key aspects of Kujira’s activity in 2023–broken down by quarter.
We all know that during the bear market the Kujira team were busy building. In early November, their efforts were recognized by the wider crypto community. We believe that this is the start of a new broader trend for the network’s growth–demonstrating exactly why KUJI will outperform in 2024.
Table of Contents
- Introduction
- KUJI Staking
- FIN Volume
- FIN Revenue
- Number of Wallets
- Minted USK
- GHOST Stablecoin APRs
- Total Value Locked (TVL)
- Takeaway
Introduction
Let us start off by explaining exactly what Kujira is:
Kujira is a decentralized ecosystem revolutionizing FinTech to provide sustainable solutions for web 3 protocols, builders, and users.
An innovation hub of revenue-generating products with great user experience, Kujira allows retail investors to access opportunities previously only available to the wealthy and elite.
docs.kujira.app
Our report captures the evolution of various metrics throughout 2023, making it easy to observe the distinct phases that characterized the evolution of the network during the previous year.
In a macro sense, crypto markets were in the middle of a sustained bear until later in the year. Then they saw a market rally along with the rise of Bitcoin leading up to the initiation of the Bitcoin ETFs. Kujira’s killer tech stack leveraged this chance to explode later in the year after sustained stability.
The initial “stable” period encompassed the first three quarters. During this time, the team focused on building new products to facilitate the network’s future expansion and metrics appeared relatively stable with no significant fluctuations. In the final quarter, KUJI became a fully circulating token, and when people realized, all metrics rapidly surged, propelling the ecosystem to a new level.

KUJI Staking
Staked KUJI serves two distinct purposes in the Kujira ecosystem: 1. Kujira distributes 98% of its blockchain revenue (and airdrops) to KUJI stakers; 2. users stake KUJI to receive proportional voting power in network governance. It takes 2 weeks to fully unstake, staked KUJI. Therefore, tracking data on the percentage of KUJI staked over time allows us to evaluate users’ confidence in Kujira’s future revenue and their desire to participate in network governance.
In recording this data, we only consider the real voting power active on the chain at any time and we count neither unbounding tokens nor tokens staked on inactive or deactivating validators.
This chart illustrates the changes throughout 2023. Although more than six of 2023’s 12 months saw an overall increase in total staked KUJI, the last quarter marked a massive surge in staking demand.
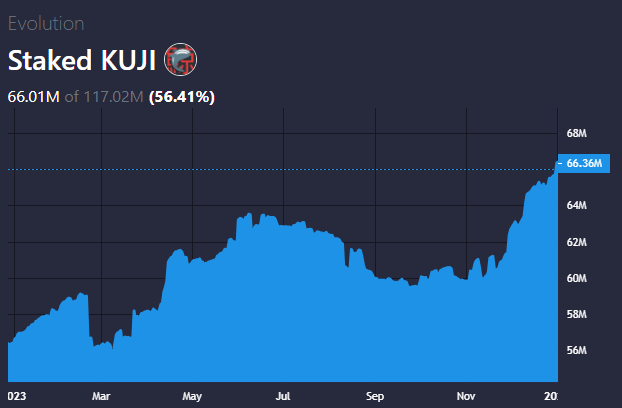
According to BLUE, KUJI’s total supply is 116.971 million tokens. Therefore, by the end of the year, over 56.43% of all KUJI was staked and locked behind a 14 day unbonding period.
Other than market demand for the KUJI token, there is one other significant factor influencing the proportion of staked KUJI: the token’s other use cases. In 2023 various products were introduced (or vastly improved) including GHOST (a money market), BOW (a liquidity hub), FIN (a decentralized exchange), and ORCA (a public liquidation market). The more use cases for KUJI other than staking (such as providing liquidity), the more attractive governance and future revenue streams need to look to attract an overall increase in the proportion of KUJI staked.
This activity potentially explains the decline in staked KUJI seen briefly in late February and for a months beginning in July. Regardless, the fact that the proportion has continued to increase indicates that expected network revenue continues to outpace the demand for all other use cases combined. It may be that airdrops such as MNTA, NSTK, and PLNK cemented the rising uptrend in KUJI staking.
FIN volume
One backbone of Kujira’s sprawling application ecosystem is FIN, Kujira’s central limit order book decentralized exchange. Thanks to FIN’s order-matching being 100% on-chain, it boasts a uniquely fair and transparent experience in contrast to DYDX, Injective, Sei, and others. Furthermore, by operating at O(1) algorithmic efficiency, FIN demonstrates infinitely more scalability.
Like other core Kujira products, 98% of revenue generated by FIN is directly distributed to KUJI stakers and the remaining 2% is distributed to Kujira’s community pool. This means that FIN’s growth not only represents ecosystem adoption but also ties trading activity to Kujira’s revenue (and KUJI’s staking APR). So FIN volumes are an important metric for us to track.
FIN charges the same proportional fees to everyone no matter who you are or how much money you have. The only distinction FIN makes is that (limit) orders which add liquidity to the FIN orderbook are charged 0.075% fees whereas (market) orders that take liquidity from the FIN orderbook are charged 0.15% fees. Limit orders allow you to buy or sell assets at a specified price (or exchange rate).
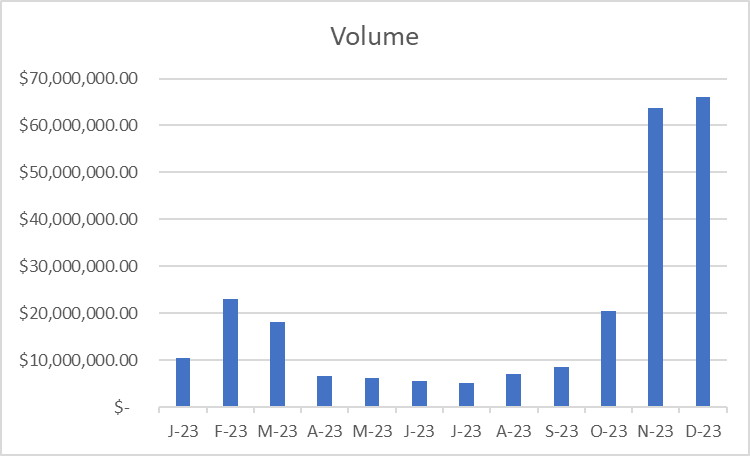
Let’s provide a numeric and visual breakdown for FIN’s monthly volume in 2023 to make it easy to see the overall trends in its adoption and growth.
Volume per quarter
1st quarter volume: $51,601,895
2nd quarter volume: $18,393,785
3rd quarter volume: $20,895,762
4th quarter volume: $150,188,794
We can see that each quarter was characterized by different overall volume trends. There are a few different factors at play that we can take into account as part of this analysis.
Late last year the Kujira team released Kujira’s liquidity hub. BOW synergizes with FIN’s nature as a central limit orderbook DEX. Unlike a normal AMM, BOW allocates liquidity far more efficiently. Even AMMs that employ concentrated liquidity solutions need to provide liquidity for every single possible exchange rate in a give range.
On the other hand, BOW only needs to provide liquidity at discrete points within a given range. More liquidity (bigger sell and buy orders) is provided farther away from the current price. As BOW orders are filled, they are automatically retracted and new ones are then placed at an adjusted price that reflects market supply and demand.
Thanks to the release of BOW in December, there was a general surge in FIN demand which led to a huge increase in Q1 volume. This slowly tapered away and Q2 saw fairly level volumes as the bear market carried on. Q3 saw a small uptrend as the ecosystem continued expand. However, it was only in Q4 where FIN volumes saw a huge upsurge as Kujira’s popularity exploded. FIN volumes will likely see a sharp increase on top of this massive growth when Kujira officially releases perpetuals.
FIN Revenue
The FIN order book charges proportional fees to every user as they transact on it. FIN limit orders incur a 0.075% fee and FIN market orders incur a 0.15% fee. For every order there is both a seller and a buyer and both sides pay fees depending on what type of order is made.
Market orders that remove liquidity from the orderbook are always paired with limit orders that first added it and limit orders that remove liquidity are always paired with other limit orders that added it. Given the increasing adoption of tools like CALC Finance and MantaSwap that are built on top of FIN, we note that most transactions are market + limit orders–which means more FIN revenue.
It’s important to note that FIN revenue doesn’t perfectly correlate with volume. Not only do different order types have different fees; some pairs like USDC/axlUSDC have unique fees; and revenue can be evaluated based on token prices at the time the trading volume actually happened or based on current prices. For this reason, analyzing FIN fees provides deeper insight into the growth of FIN as a revenue vehicle for Kujira and the behavioral makeup and preferences of ecosystem users.
At Kujira Track, we evaluate revenue based on token valuations at the time FIN volume is generated. This best reflects real-time market conditions in aggregate since the crypto market can be volatile and the overall result may otherwise be biased by local market trends.
Fees per quarter
1st quarter total: $129,004
2nd quarter total: $45,984
3rd quarter total: $50,479
4th quarter total: $343,672
We get a clear picture from this quarterly breakdown. BOW has brought in necessary liquidity for an upsurge in FIN volumes. In Q1, most trading volume was limited to KUJI pairs, but with the ecosystem developing mainstay alts (FUZN, WINK, MNTA, NSTK, etc.), FIN adding blue chips such as SOL, ETH, and BTC; and BOW adding liquidity on existing pairs, Q4 saw many new popular pairs.
One of the most important aspects of FIN is its overall liquidity. As the Kujira ecosystem sees more liquidity, volumes naturally increase as it’s easier to buy and sell in size (and it’s easier for traders to make a profit on smaller spreads). This creates more revenue and generated fees to stakers, which generates buzz for FIN, leading to even more volume and fees.
BOW brought in necessary liquidity for an upsurge in FIN volumes. As the Kujira ecosystem’s TVL continues to skyrocket and liquidity continues to rise, FIN can cement itself in a dominant position.
Assuming the much higher revenue beginning in November and December persists onwards, it would be most accurate to project FIN yearly revenue (without taking future growth into account) by just looking at revenue from those two months. But for the sake of being conservative, based on the full Q4’s revenue–revenue from FIN (one of many Kujira core dApps) is around $1.37 million.
Number of Wallets
One valuable metric that helps understand the overall growth and health of a blockchain is its total number of addresses over time. As people more interested in a project, it ships new products, creates a new wallet, or does something else to attract new users over, then new wallets with unique addresses are created as part of their onboarding process into the ecosystem.
As it so happens, Kujira is developing its own sleek native wallet called SONAR that provides the best in class experience on the Kujira blockchain. Although it is still in an open beta and new core features are being added over time, SONAR has been fully functional for months. With its recent Circle Cross Transfer Protocol integration, it’s more accessible than ever. Combined with a confluence of other factors, this has led an uptrend in new Kujira addresses ever since SONAR’s public beta.
It is important to understand that some users will split their funds across multiple wallets for the sake of better securing their funds so the data isn’t a perfect indication. Furthermore, certain days have seen bot activity which has inflated the metrics. This is difficult to isolate and remove and we just manually query the RPC to present the relevant raw data without any doctoring or censorship.
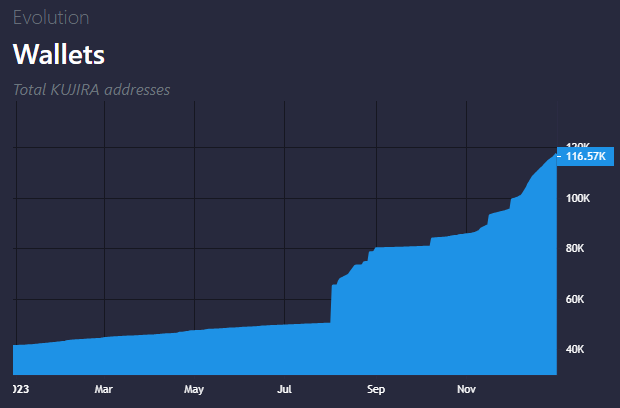
Although it is not an exact measure, in combination with the other trends mentioned above, the total number of addresses helps us understand Kujira ecosystem over the last year. It’s interesting to note that in line with other metrics being way up in November, 50% of all addresses that entered the ecosystem in 2023, entered in just those last two months. And we can further put this in context.
The team is developing a native wallet to bring more people in the ecosystem. Volumes and liquidity are way up. A money market has launched which lets individuals to do more with their assets than ever. Many other new applications are in the pipeline. This explosion in adoption is inevitable.
Minted USK
USK is Kujira’s native stablecoin solution that is robust, decentralized, and sovereign. Along with KUJI, USK is the gateway to Kujira’s product suite which provides opportunities previously reserved to the wealthy and elite. To ensure stability and anti-fragility, USK is 166% overcollateralized by a diversified basket of high-quality assets and supported by Kujira’s public liquidation marketplace, ORCA.
In essence, people can mint USK to give their otherwise idle assets liquidity and then use that liquidity in the Kujira DeFi ecosystem (or elsewhere especially as USK integrations grow with time). So by measuring the amount of USK in circulation, we can use it as a proxy for overall ecosystem demand at any given time. This is because USK is an entrance ticket to Kujira.
Aside from its usage in Kujira’s decentralized applications, USK also directly contributes to Kujira’s revenue in other ways. For one, USK is a gas option on Kujira (along with KUJI). And second, USK mint positions incur a 1% annual interest rate as revenue and a one-time 0.1% mint fee. This is distributed to KUJI stakers. So tracking USK growth is a good way to evaluate another income stream for Kujira.

As depicted in the above chart, USK’s supply was mostly stable for the first 8 months and then saw crazy growth since September which became exponential over the last quarter. Although one might question if this seems to be earlier than with Kujira’s other ecosystem metrics, this is actually in line with SONAR’s beta release and the sharp uptick in overall ecosystem addresses afterwards. Overall the data reinforces our theory that Kujira experienced robust growth, well above the norm, in Q4.
Leveraged BOW LPs, perpetuals markets, and so on will likely hasten USK adoption even further.
GHOST Stablecoin APRs
Kujira’s Money Market, GHOST, launched in May 2023 and has swiftly evolved into a formidable protocol packed with TVL. The decentralized protocol groups and pairs would be borrowers and lenders together while automatically adjusting borrow/lending interest rates algorithmically depending on market supply/demand. This has lend to juicy average rates for many different assets, including stables, without any additional incentivization on our side.
Generally, when over approximately 60% of the supply of an asset is lent out, the interest rates (borrowing and lending) for that asset starts rising exponentially to encourage borrowers to unwind their positions and encourage new would-be lenders to participate. Thanks to the team’s invention of Unstake.fi (powered by GHOST) which promises to allow users to instantly unstake liquid staked tokens, native assets, and much more, this also promises to keep GHOST APRs juicy across pairs.
All in all, robust use of GHOST is good for Kujira revenue, as 0.2% of every borrow position is dispensed to KUJI stakers in addition to all accrued interest on any borrow position. GHOST lenders (who receive xTOKENs in return) meanwhile are incentivized to use their xTOKENs in Kujira dApps such as FIN or ORCA. This allows xTOKEN holders to passively earn while doing other things. This benefit is especially pronounced when holding stablecoins–as there are no unsustainable incentives at play and any APRs (although often cyclical) are entirely organic due to long or short demand.
In this section, we primarily delve into GHOST’s APR trends for stablecoins in 2023. At the moment, on Kujira there are 3 main candidates: USK, axlUSDC, and USDC. Their performance metrics capture more bullish Kujira trends. USDC has the least data as it is relatively new to the Cosmos ecosystem.
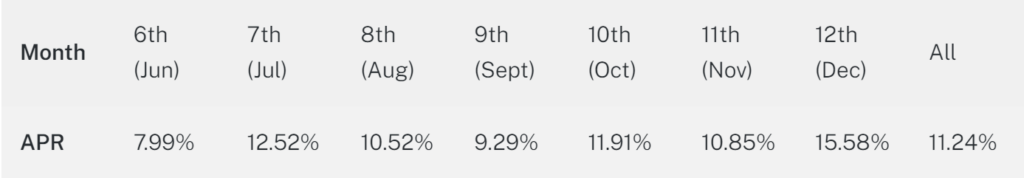
USK
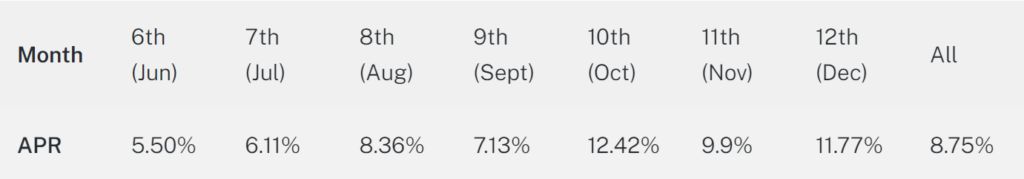
axlUSDC
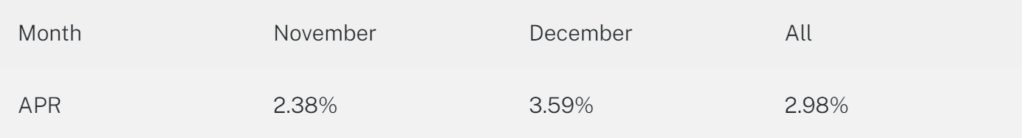
USDC
Stablecoin APR interest rates are likely to continue increasing over the year especially if the market flips bullish which incentivizes more borrowing (and higher lend APRs). Currently, based on the last 7 months of the year: USK has an average lending rate of 11.24% with monthly minimum and maximum average lending rates of 7.99% and 15.58%. axlUSDC has an average rate of 8.75% with monthly minimum and maximum average lending rates of 5.50% and 12.42%. What is clear is that stables saw higher rates in Q4 when the ecosystem was seeing a lot of growth and overall borrowing was higher.
USDC has started to see a lot more adoption and integration into the Kujira ecosystem. So it’s only a matter of time before we see higher interest rates there as well (something we have already started seeing). Either way, combined with BOW Leveraged LPs, lending Stablecoins in GHOST remains promising and represents another stream of income for stakers.
Furthermore, later this year, Nami Protocol plans to ship a mechanism that will allow anyone to automatically stake their stables in GHOST and move them between the most lucrative pairs so they can get the best bang for their buck even after fees. With various protocols now also starting to tap into GHOST APRs as the amount of borrowing continues to rise, it’ll be interesting to investigate related future trends and see how they evolve.
Total Value Locked (TVL)
Total Value Locked is a crucial metric when understanding and evaluating an effective financial ecosystem. The value that is actually locked in a protocol refers to the amount of capital actually being used in its related services or products. This demonstrates a high level of trust in its contracts and inherent demand in using its services.
Let’s take a look at some data from DefiLlama about Kujira’s TVL over time throughout all of 2023.

Kujira’s TVL saw a massive increase from January 1st 2023 through January 1st 2024 from 3.55 million USD to 112.33 million USD. Kujira’s explosive increase in TVL of over 30x demonstrates greatly increasing interest in Kujira from users of all different sizes throughout 2023.
In December 2022, the Kujira team released BOW to help bring more liquidity to FIN and prepare the Kujira flywheel. In mid 2023, the Kujira team released GHOST, which started spinning this liquidity flywheel. With the advent of SONAR, the token fully circulating, and other catalysts such as NSTK later in the year, protocol TVL greatly increased in Q4, and likely will continue this same uptrend.
Kujira differentiates itself from chains that tout products without actual use or innovation because no one actually wants to use their services and instead simply peddle a token concept or idea. Instead, the network develops new technology that can actually help improve people’s lives and give them financial opportunities that are literally impossible for them to find anywhere else.
Takeaway
In this report, we examined various key metrics based on the data we actually track and report on at Kujira Track. We hopefully have made it clear that last year saw a huge period of growth in Q4 as a result of various key catalysts that combined when KUJI became fully circulating.
Various metrics such as an increasing USK supply, high money market stable coin APRs, rapidly rising ecosystem wallet numbers, growing FIN volumes and revenue, surging TVL, and an explosive uptrend in the proportion of the KUJI supply locked up via staking all tell a story about a wider confluence of factors that have started to come together since November of last year.
KUJI has now started to achieve broader public awareness. And we believe that based on the underlying data such as Total Value Locked, increasing liquidity, composable core infrastructure, growing team, and bold product innovation–Kujira’s growth phase is only just beginning.
We encourage everyone to look forward to our next report as we’re starting a regular monthly report. It’s important to shed light on Kujira’s key metrics and provide accompanying insights so people understand where we’re coming from and where we’re going while being able to see all the growth happening behind the scenes as the team and community continue to build together.
- The actual supply of KUJI is 116.97 million staked tokens due to validator token slashing. We’re updating this. The result is that every estimate for total percent staked is even higher. ↩︎
Data extracted from https://kujira-track.app and DefiLlama
Report written by Daniel Lux